Render a model’s reaction network (pysb.tools.render_reactions)
Usage
Usage: python -m pysb.tools.render_reactions mymodel.py > mymodel.dot
If your model uses species as expression rates, you can visualize these interactions by including the –include-rate-species option:
python -m pysb.tools.render_reactions --include-rate-species mymodel.py > mymodel.dot
Renders the reactions produced by a model into the “dot” graph format which can be visualized with Graphviz.
To create a PDF from the .dot file, use the “dot” command from Graphviz:
dot mymodel.dot -T pdf -O
This will create mymodel.dot.pdf. You can also change the “dot” command to one of the other Graphviz drawing tools for a different type of layout. Note that you can pipe the output of render_reactions straight into Graphviz without creating an intermediate .dot file, which is especially helpful if you are making continuous changes to the model and need to visualize your changes repeatedly:
python -m pysb.tools.render_reactions mymodel.py | dot -T pdf -o mymodel.pdf
Note that some PDF viewers will auto-reload a changed PDF, so you may not even need to manually reopen it every time you rerun the tool.
Output for Robertson example model
The Robertson example model (in pysb.examples.robertson) contains
the following three reactions:
A -> B
B + B -> B + C
C + B -> C + A
The reaction network diagram for this system as generated by this module and
rendered using dot is shown below:
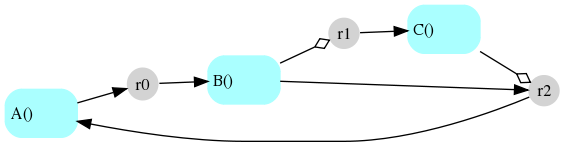
Circular nodes (r0, r1 and r2) indicate reactions; square nodes
(A(), B() and C()) indicate species. Incoming arrows from a species
node to a reaction node indicate that the species is a reactant; outgoing
arrows from a reaction node to a species node indicate that the species is a
product. A hollow diamond-tipped arrow from a species to a reaction indicates
that the species is involved as both a reactant and a product, i.e., it serves
as a “modifier” (enzyme or catalyst).
- pysb.tools.render_reactions.run(model, include_rate_species=False)[source]
Render the reactions produced by a model into the “dot” graph format.
- Parameters:
- modelpysb.core.Model
The model to render.
- include_rate_speciesbool
- If True, enable multigraph and add dashed edges from species used in
expression rates to the node representing the reaction.
- Returns:
- string
The dot format output.